
A pedigree looks like a family tree, it shows information about inherited traits throughout successive generations.
A basic pedigree chart for a simple cross is quite easy to do:
Circles represent Females, squares represent the males.
The offspring of the parents will also be identified this way, circles and squares.
The P stands for Parent so the original union is noted as P1 & P2
The F stands for filial and represents successive generations. i.e. F1, F2 etc.
For example we have a Mother and a father, they breed and the successive progeny will inherit traits from each parent, they could inherit some dominant traits or some recessive traits.

Now if the successive generations carry on breeding the chart continues and so does the variation and expression of other traits.
Mendillian law, states that the presence of dominant alleles will lead to the expression of dominant traits.
Some of the shapes are shaded and some are not, these shaded shapes are the genes or traits we are wanting to follow across the pedigree.
There are a few important things to note here regarding the allele you are wanting to follow, it will be either;
Autosomal Dominance, if the parents have the same allele.
Autosomal Recessive, if the parents have the same allele, recessive alleles are only expressed when there is no dominant alleles present, otherwise dominance proceeds.
In the case of the dominant allele not being present, recessive alleles are expressed.
For example if the Autosomal trait we are following is height;
Dominant = TT or Tt
Recessive = tt
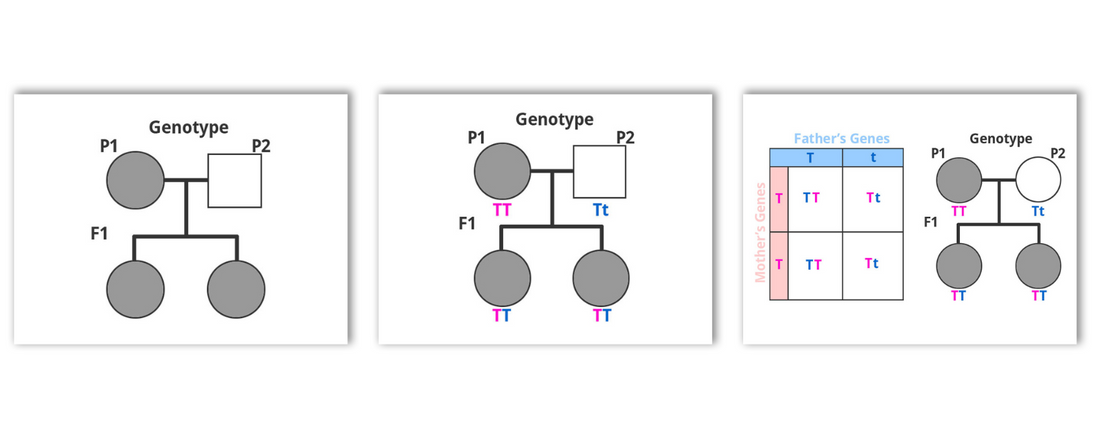
In this next picture we are showing the genotype and the trait we are tracking, for example Height.

If the letter is capitalised it is dominant, we will shade the box associated with it, any box that is shaded will be dominant in height.
The F1 offspring get an allele from each parent, and the progeny are all tall for that specific trait.
 Pictured above: 50% Dominant heterozygous, 50% dominant/recessive heterozygous
This is a very small pedigree and hopefully easy enough to understand, there are obviously many traits we would want to quantify when forming true breeding lines so you can imagine how big these pedigree charts can become. When used in conjunction with Punnett squares, you will be able to theoretically predict potential future breeds without having to do much physical work, then when you’re ready you exercise that theory.